Ease of Living: Another Virtual Data-driven Matrix Far Away from Reality
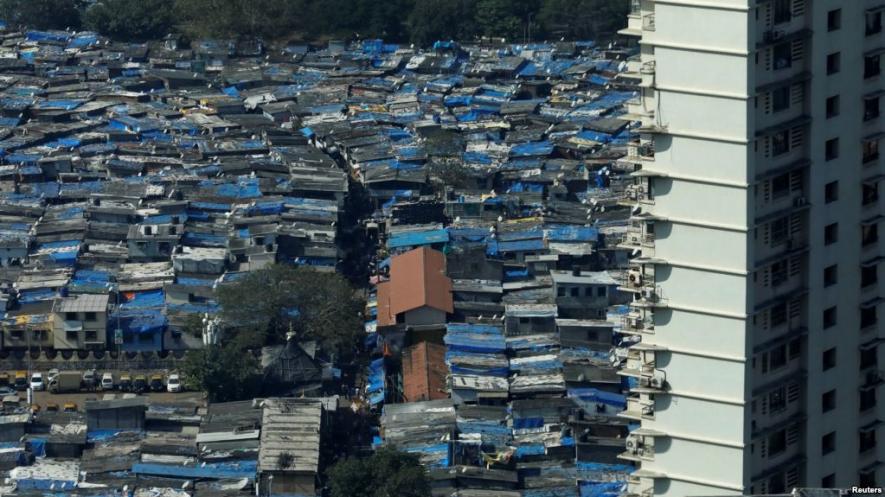
Just recently, the Ministry of Housing and Urban Affairs (MoHUA), New Delhi, has released a list of 111 cities, which were ranked in a survey based on a new criteria called the ‘ease of living index’ (EoLI). According to the list, Pune tops the cities in the country, which is supposedly easiest to live in and of the 111 cities, Rampur in UP ranks the last. Well, this is just for the given numbers of 111, those which do not figure in the list are worse than the present lot and this means that living a decent life is a serious challenge in such cities!
The top 10 includes cities like Navi Mumbai and Mumbai at number 2 and 3, respectively, followed by Tirupati at the fourth position whereas Chandigarh finds itself ranked at the fifth position. If one looks at the geographical space of the country, 6 cities in the first ten are from the south and just 1 from the north. Big cities like Bengaluru, Chennai and Delhi lag behind in the list. The main work behind the survey was done by three major players (consultants) in the market namely, Athena Infonomics private limited, Ipsos research private limited and the Economist Intelligence unit. All of them have experts from urban planning, economics, climate change experts, etc. Most of them are in tandem to the present ideology of ‘competitive cities’.
The World Bank guided data-driven methodology for measuring data in the cities and quantifying either by ‘ease of doing business’ phraseology or ‘ease of living’ is in a way top- bottom approach of planning and strategising the city. But cities cannot just be about infrastructure. The infrastructure has to be for the people and according to a noted urban sociologist Robert Park, “the city is man's most consistent and on the whole, his most successful attempt to remake the world he lives in more after his heart's desire. But, if the city is the world which man created, it is the world in which he is henceforth condemned to live. Thus, indirectly, and without any clear sense of the nature of his task, in making the city man has remade himself.” The ease of living matrix may sound quite affirmative but unfortunately, instead of measuring the livability in the cities, it is driven more by the agenda of data handling corporates.
One of the faculty members from the School of Planning and Architecture (SPA), Delhi, has termed the entire exercise as sheer gimmick. The present logic propounded by the ruling establishment that the cities must be competitive and must have a competition amongst them is representative of the present neo-liberal paradigm shift in urbanisation. The cities which are screaming for investments find their roles changed and have metamorphosed from being managers in governance to real entrepreneurs (which is not the role of the city). For that, the land use plans are being changed and the cities are asked to work like a business unit. The Special Purpose Vehicles (SPV) in the smart cities are registered under the companies act and are not answerable to the city governments by the argument that bypassing the elected institutions will enhance the pace of the projects.
There is nothing much substantive in the ease of living; rather it is an exercise where the secondary data collected from the cities is in contradiction to the ground realities. The data-driven index is far away from the real index of the people.
Concisely, the way cities are being shaped in the country can be summarised into:
- Privatisation of cities –not just governance but land which is seen as a major instrument to attract investment.
- Cities being governed more through data which is being handled by large companies like IBM, Cisco, etc., to ensure that the data is utilised for the furtherance of privatisation of cities and
- The utilities and other responsibilities of the cities are either shed to private players or the PPP model of governance is developed.
- The matrix of the ‘ease of living’ is in conjunction to the above three requirements. The four pillars on which the entire exercise of EoLI has been based include:
- institutional ,
- social,
- economic and
- physical.
There are 15 categories in which the cities through their available data have been quantified. These are governance; education; identity and culture; health; safety and security; economy and employment; housing and inclusiveness; public open spaces; mixed land use and compactness; power supply; transportation and mobility; assured water supply; waste water management; solid waste management; and reduced pollution.
In the governance model, the cities are being developed in a way that a central command and control centre can be set up, so that such a centre can monitor everything within the city. There is no difference of opinion as to whether such centres should be developed or not. Who would not like to have such governance where from one office everything gets monitored at a click of the mouse? But the point is who owns these command centres. These centres are developed by mega giant data operators and earn phenomenal profit from the city. The smart city is a classic example of it. The smart city is an urban development plan that uses data points to automate citywide responsibilities such as policing, traffic, and energy. These plans transfer key decisions from local governments to multinational corporations, while privatising many urban services traditionally governed by municipal officials. Bloomberg reported that the Internet of Things (IoT) represents a $19 trillion opportunity. Forbes estimated that the Smart City industry is expected to become an over 1.5 trillion dollar market by 2020. This new industry signals the privatisation and financialisation of public service provisions, and will accelerate the growth of inequality in our societies by bringing increased convenience and services to the wealthy few at the cost of the public as a whole. The technocratic Smart City is curtailing individual freedoms and rights, and leading us to an ‘Orwellian future’. That future cannot be the ease of living dictum.
Now coming to the actual data and how subjectively it has been read.
We have seen reports from various newspapers where cities are not just ridiculing the EoLI but are screaming and accusing that the data punched is fudged.
Take for example the cities of the south like Trivandrum which till 2017 was the best city for two consecutive years. Janagraha, mapping cities under the Annual Survey of India’s City-Systems (ASICS), developed a matrix of mapping the cities in the country that included “annual health check up of quality of laws, policies, institutions and institutional processes underlying quality of life in our cities.” Trivandrum, which was the best in the country under the Janagraha, is at rank71 in the EoLI. Similarly, cities of Chennai and Kochi have expressed shock at the way in which this report has been prepared.
Another glaring fact that has been overlooked is the contemporary condition of slums in the urban areas. The matrix does not qualify those cities which have shown remarkable progress in addressing some of the important issues in slums. These include the delivery of service utilities like tap water, electricity etc. A census report states that 64 million people live in India's slums. Over 70 per cent of slum households get their water from a tap, but just half of them get water in their homes. However, the efforts made by some of the cities to outreach a larger population in the slums do not find a mention in the appraisal. Take for example a city in north India where irrespective of the fact that the land entitlement is not with the slum holders, they have been provided with metered water and electricity connections. This has not only eased the life of the people (who earlier either had to fetch water from a long distance or steal), but has also reduced the non revenue water. This does not even figure in their (consultants of EoLI) imagination. Similarly, those cities which were unable to provide the data owing to the large number of agencies involved in the city management have got a blank in the scoring. This method is erroneous.
The mountain cities have another complaint regarding the ranking method. For the mountain cities, the parameters of the plains cannot be applied. The mountain cities require additional resources to ensure water and manage their solid waste management. One of the important areas of mobility –pedestrianisation and its promotion is also missing in the matrix designed by EoLI. Mobility does not only mean construction of flyovers and widening the roads. This is not an inclusive form of mobility.
Let us also closely examine some of the cities that have topped in the different categories and how difficult it is to believe that what has been reported is true. In the category of identity and culture, Chandigarh gets the highest score of 4.39, whereas the city is newly built and there are cities which are more than 300 years old and have a far richer heritage and culture, but did not feature in the report. In the category of governance, Navi Mumbai tops with 16.7/25. There will be many cities which are far better governed like Gangtok where the city has not just banned polythene, but non-organic vegetables are not allowed to enter the city and this decision is being enforced strictly. Likewise and quite strangely, Faridabad tops the category of education with a score of 6.01/6.25. In any given standard, Delhi has far better educational institutions and standards. Even Chandigarh is far above. In housing and inclusiveness, Ghaziabad is at the top with a score of 2.82. It seems the city that got the best award in social housing i.e. Sholapur, with over 10000 houses constructed by the Beedi workers federation was not even considered. There are errors on the face of it when one goes through the list. Another shocking revelation is the highest points awarded to Ludhiana city under the pollution category, while it is a known fact that Ludhiana has high problems of pollution - both air and noise, owing to the large number of cars and the industries around. Northern and mountain cities with cleaner air are nowhere near the top few in the category.
The EoLI is another precursor at the data-driven model of city and it is believed that larger the data, easier it is to live in. Here I am reminded of an anecdotal conversation between Park Won Son, the Metropolitan Mayor of Seoul and a friend of mine and myself. During a World Cities Congress in Seoul, as both of us were discussing the challenges being faced in our cities, I pointed out one of them and said that we are in urgent need of opening rehabilitation centres for the youth in our cities because of the menace of drug addiction. Some how, Park did not comprehend the word ‘drug’ (though he is good at English) and said “Yeah yeah! Even we are opening de-addiction centers in Seoul,” to my astonishment. I enquired, “But I did not see the young addicted to drugs in South Korea.” He laughed and said “Oh no-no, not centres of rehabilitation for drug addicts but these high data usage addicts who are getting psychological problems.”
I believe our cities are not following the same path. Ease of living for us as defined by Harvey is also a right to the city to live with dignity!
Get the latest reports & analysis with people's perspective on Protests, movements & deep analytical videos, discussions of the current affairs in your Telegram app. Subscribe to NewsClick's Telegram channel & get Real-Time updates on stories, as they get published on our website.


